Canva — Admin Reporting
Reporting, Data visualisation, AI
An admin at a large company gets asked the same questions every quarter. Who is using this? Are approvals stuck? Are we about to run out of AI credits? I worked on Admin Insights, part of Reporting 2026, to answer them in one place.
- Role
- Principal Product Designer
- Team
- Reporting
- Timeline
- 2026
- Platform
- Web
The problem
Reports that grew one at a time
Answers were scattered, and every report behaved a little differently, so each new one made the set harder to read.
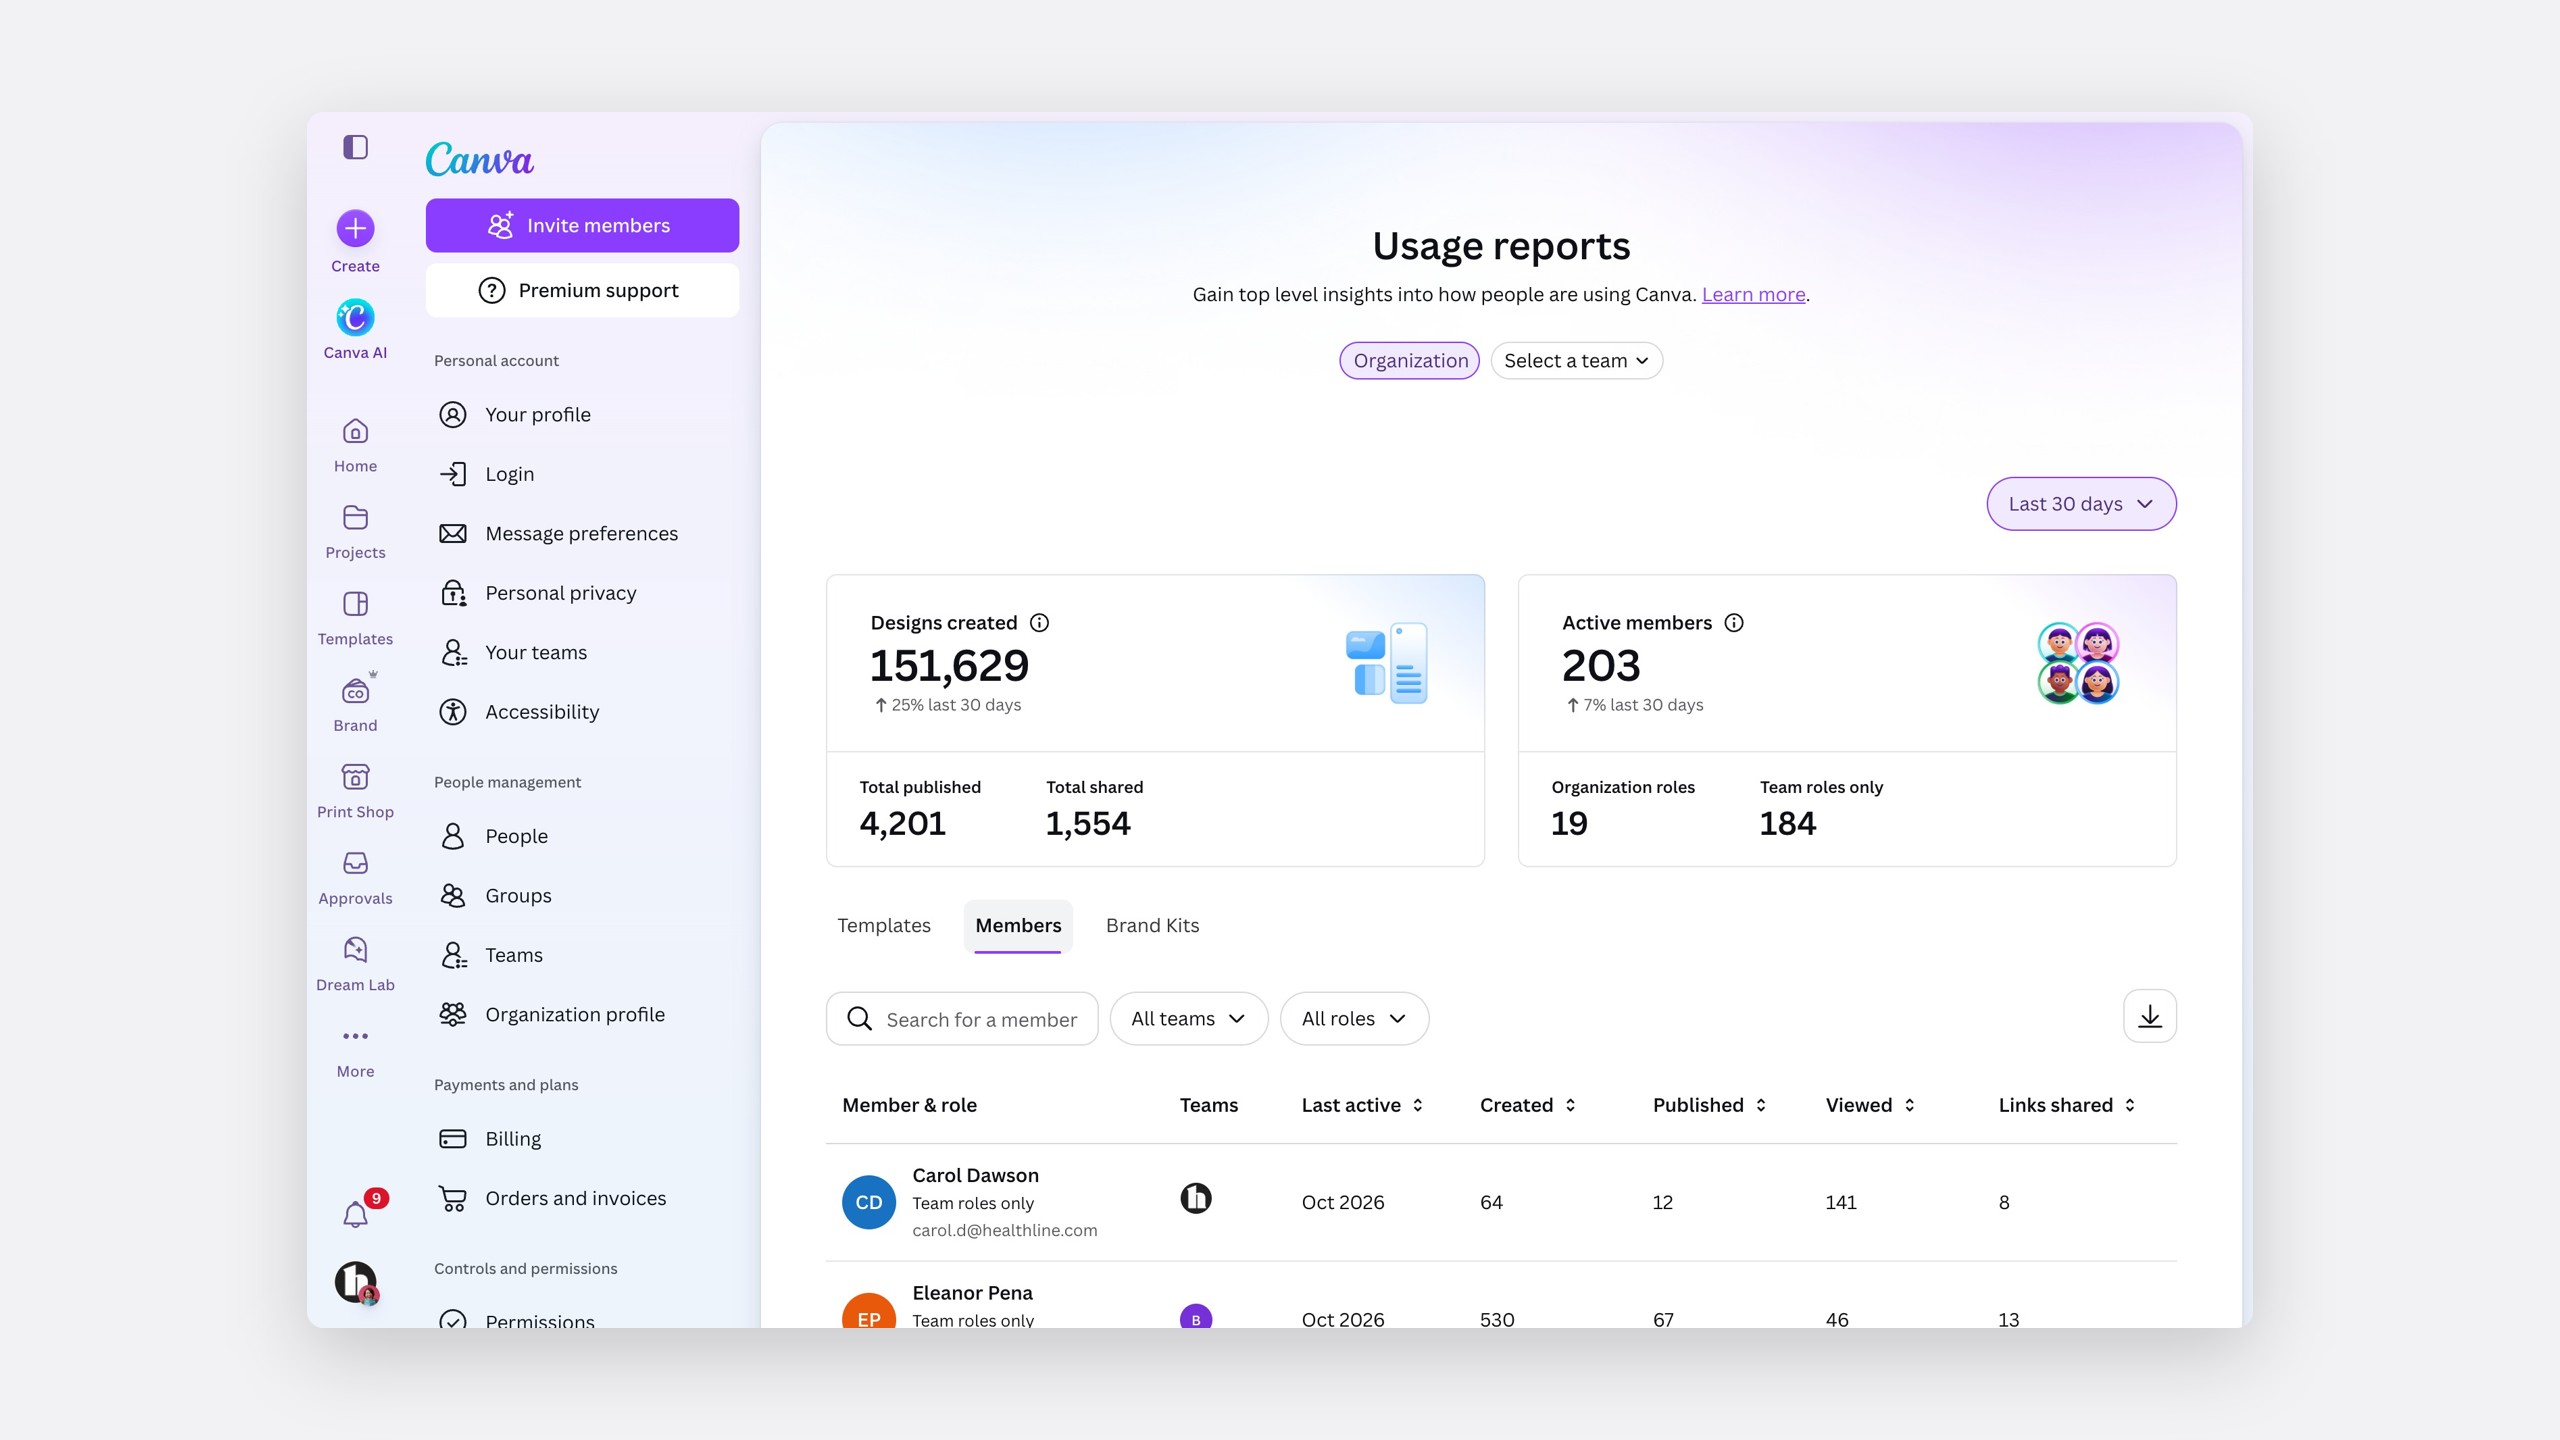
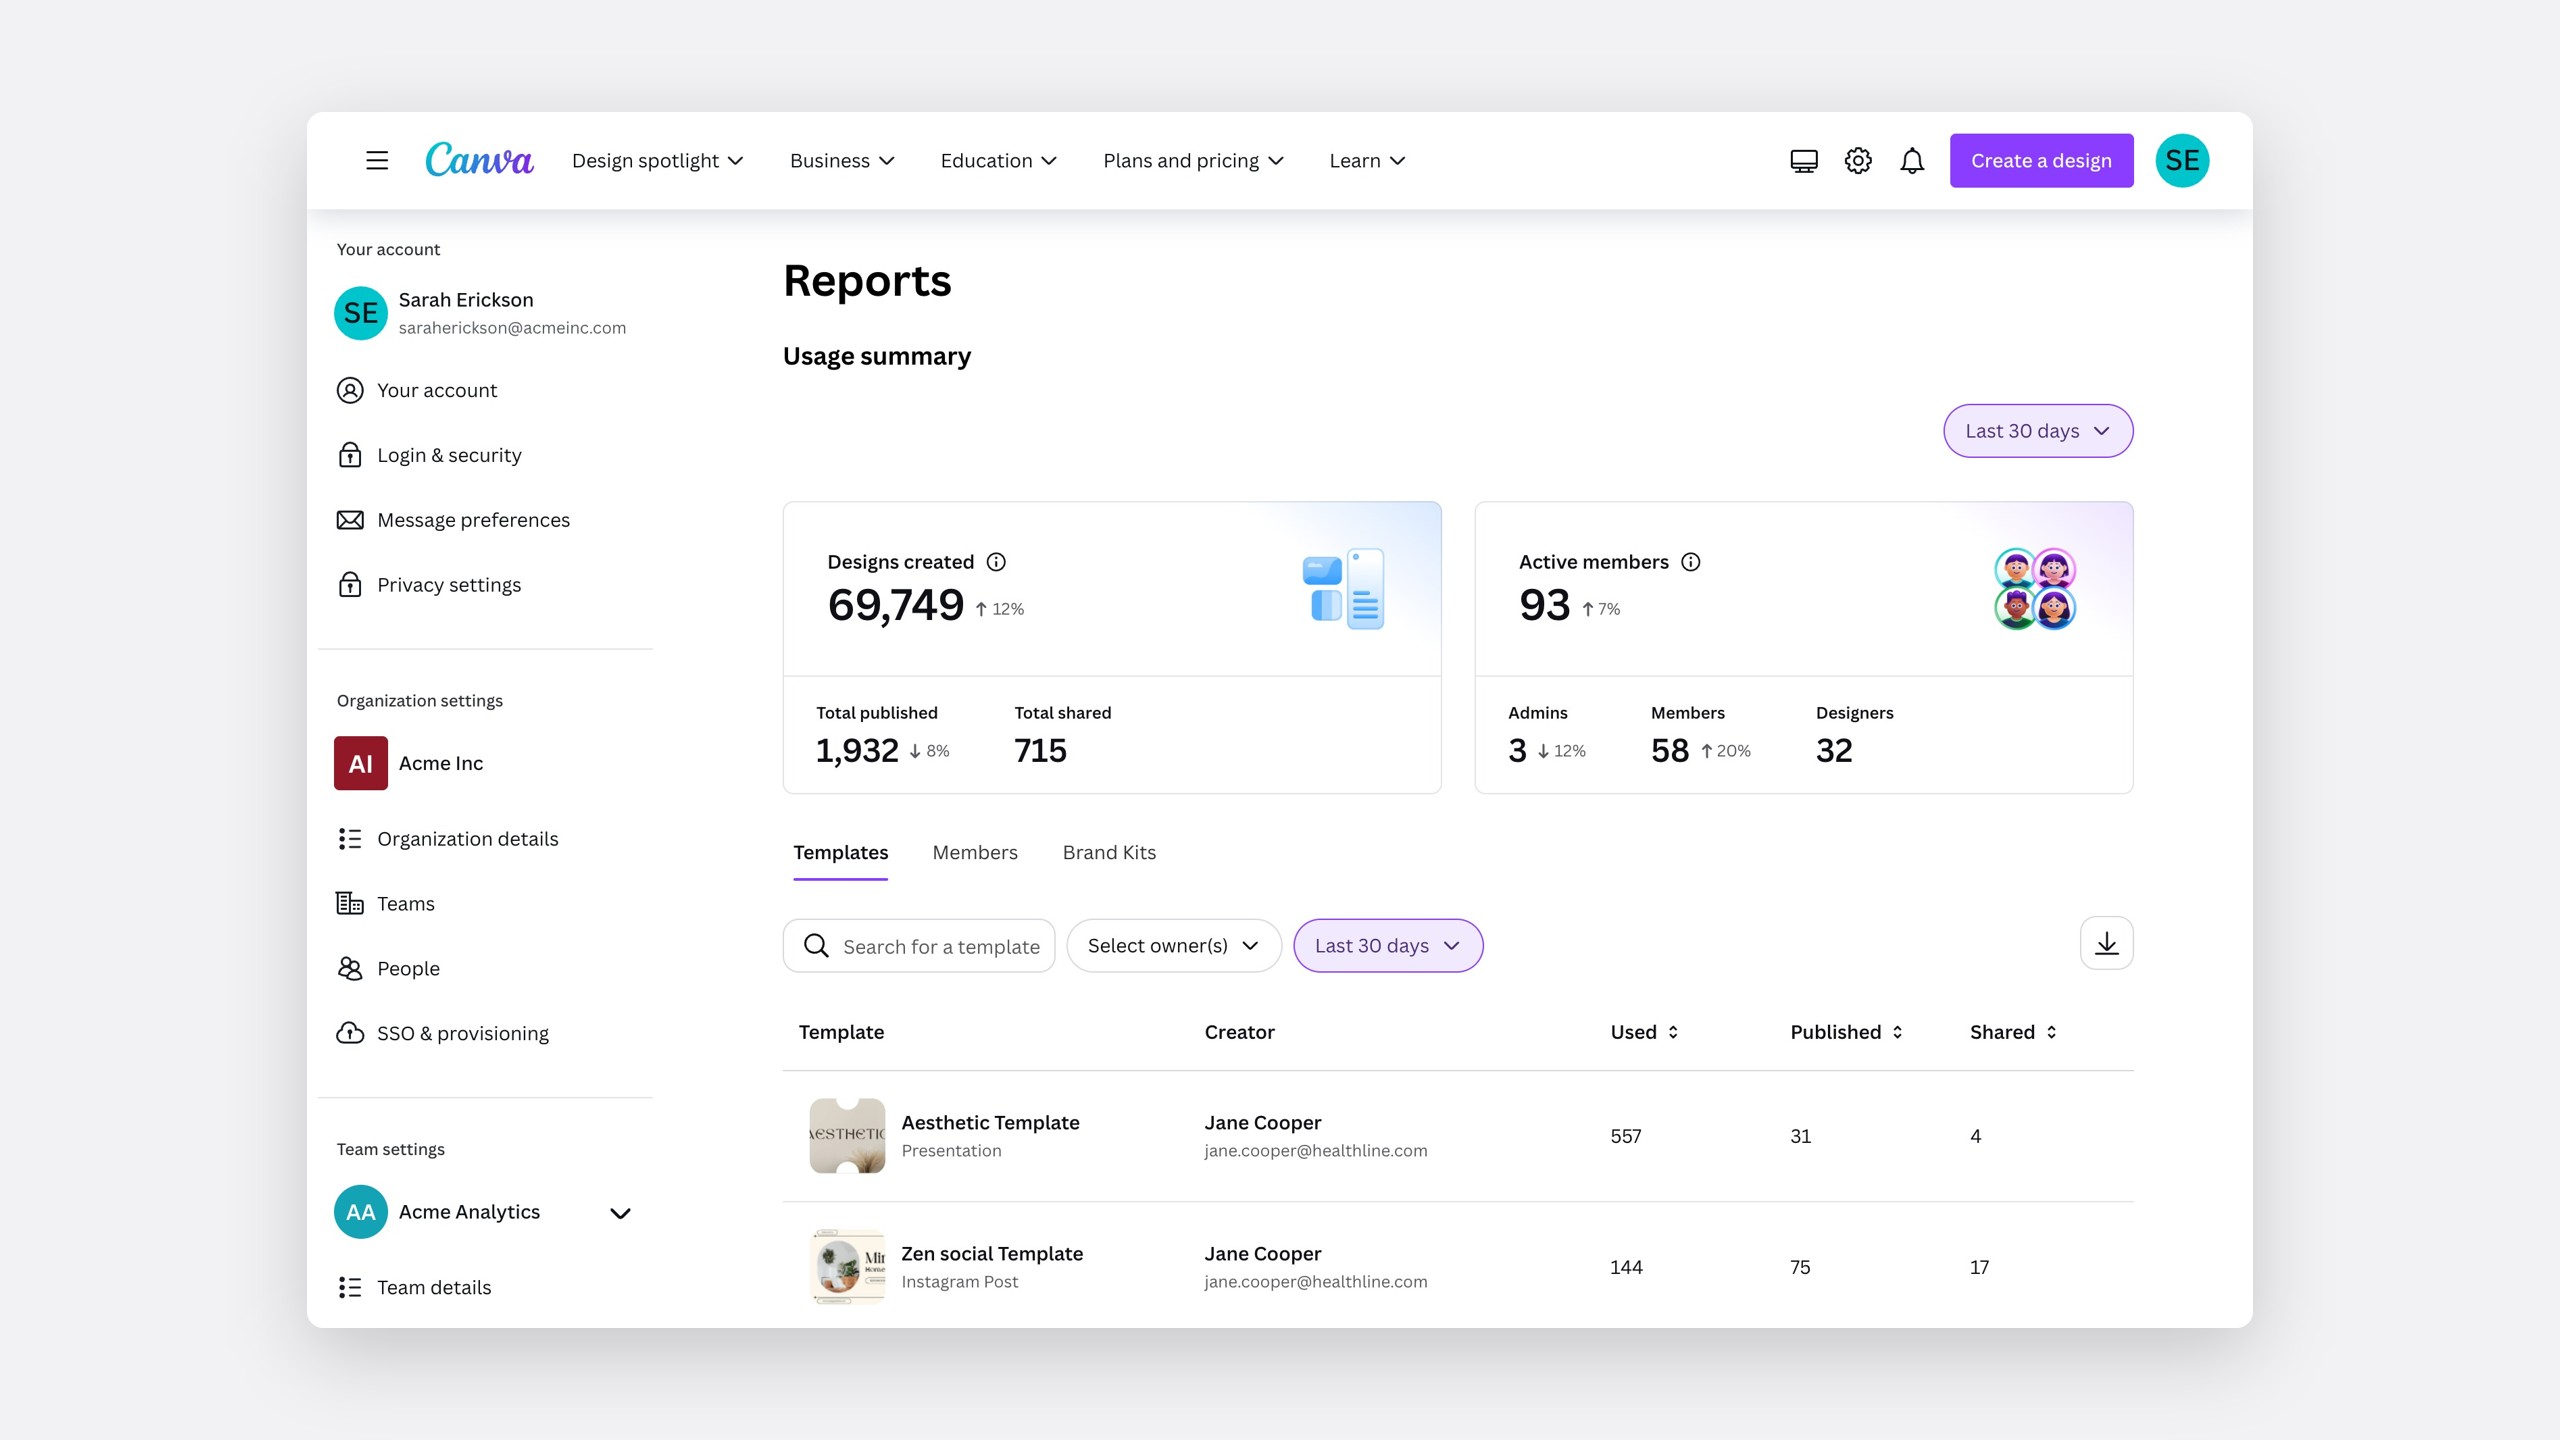 BeforeAfter
My role
The report set, the glow-up and AI usage
With a co-worker, I designed the report set, the glow-up and the AI usage views.
The process
Start from the question
The solution
Questions become reports
The question
"How long do approvals take?"
Design Approvals insights show turnaround times, so brand teams see where reviews stall.
The question
"Who is actually designing?"
Design and member activity show who is creating.
The question
"Is anyone using the brand kit we paid for?"
Brand Kit and Brand Template activity show whether it is used.
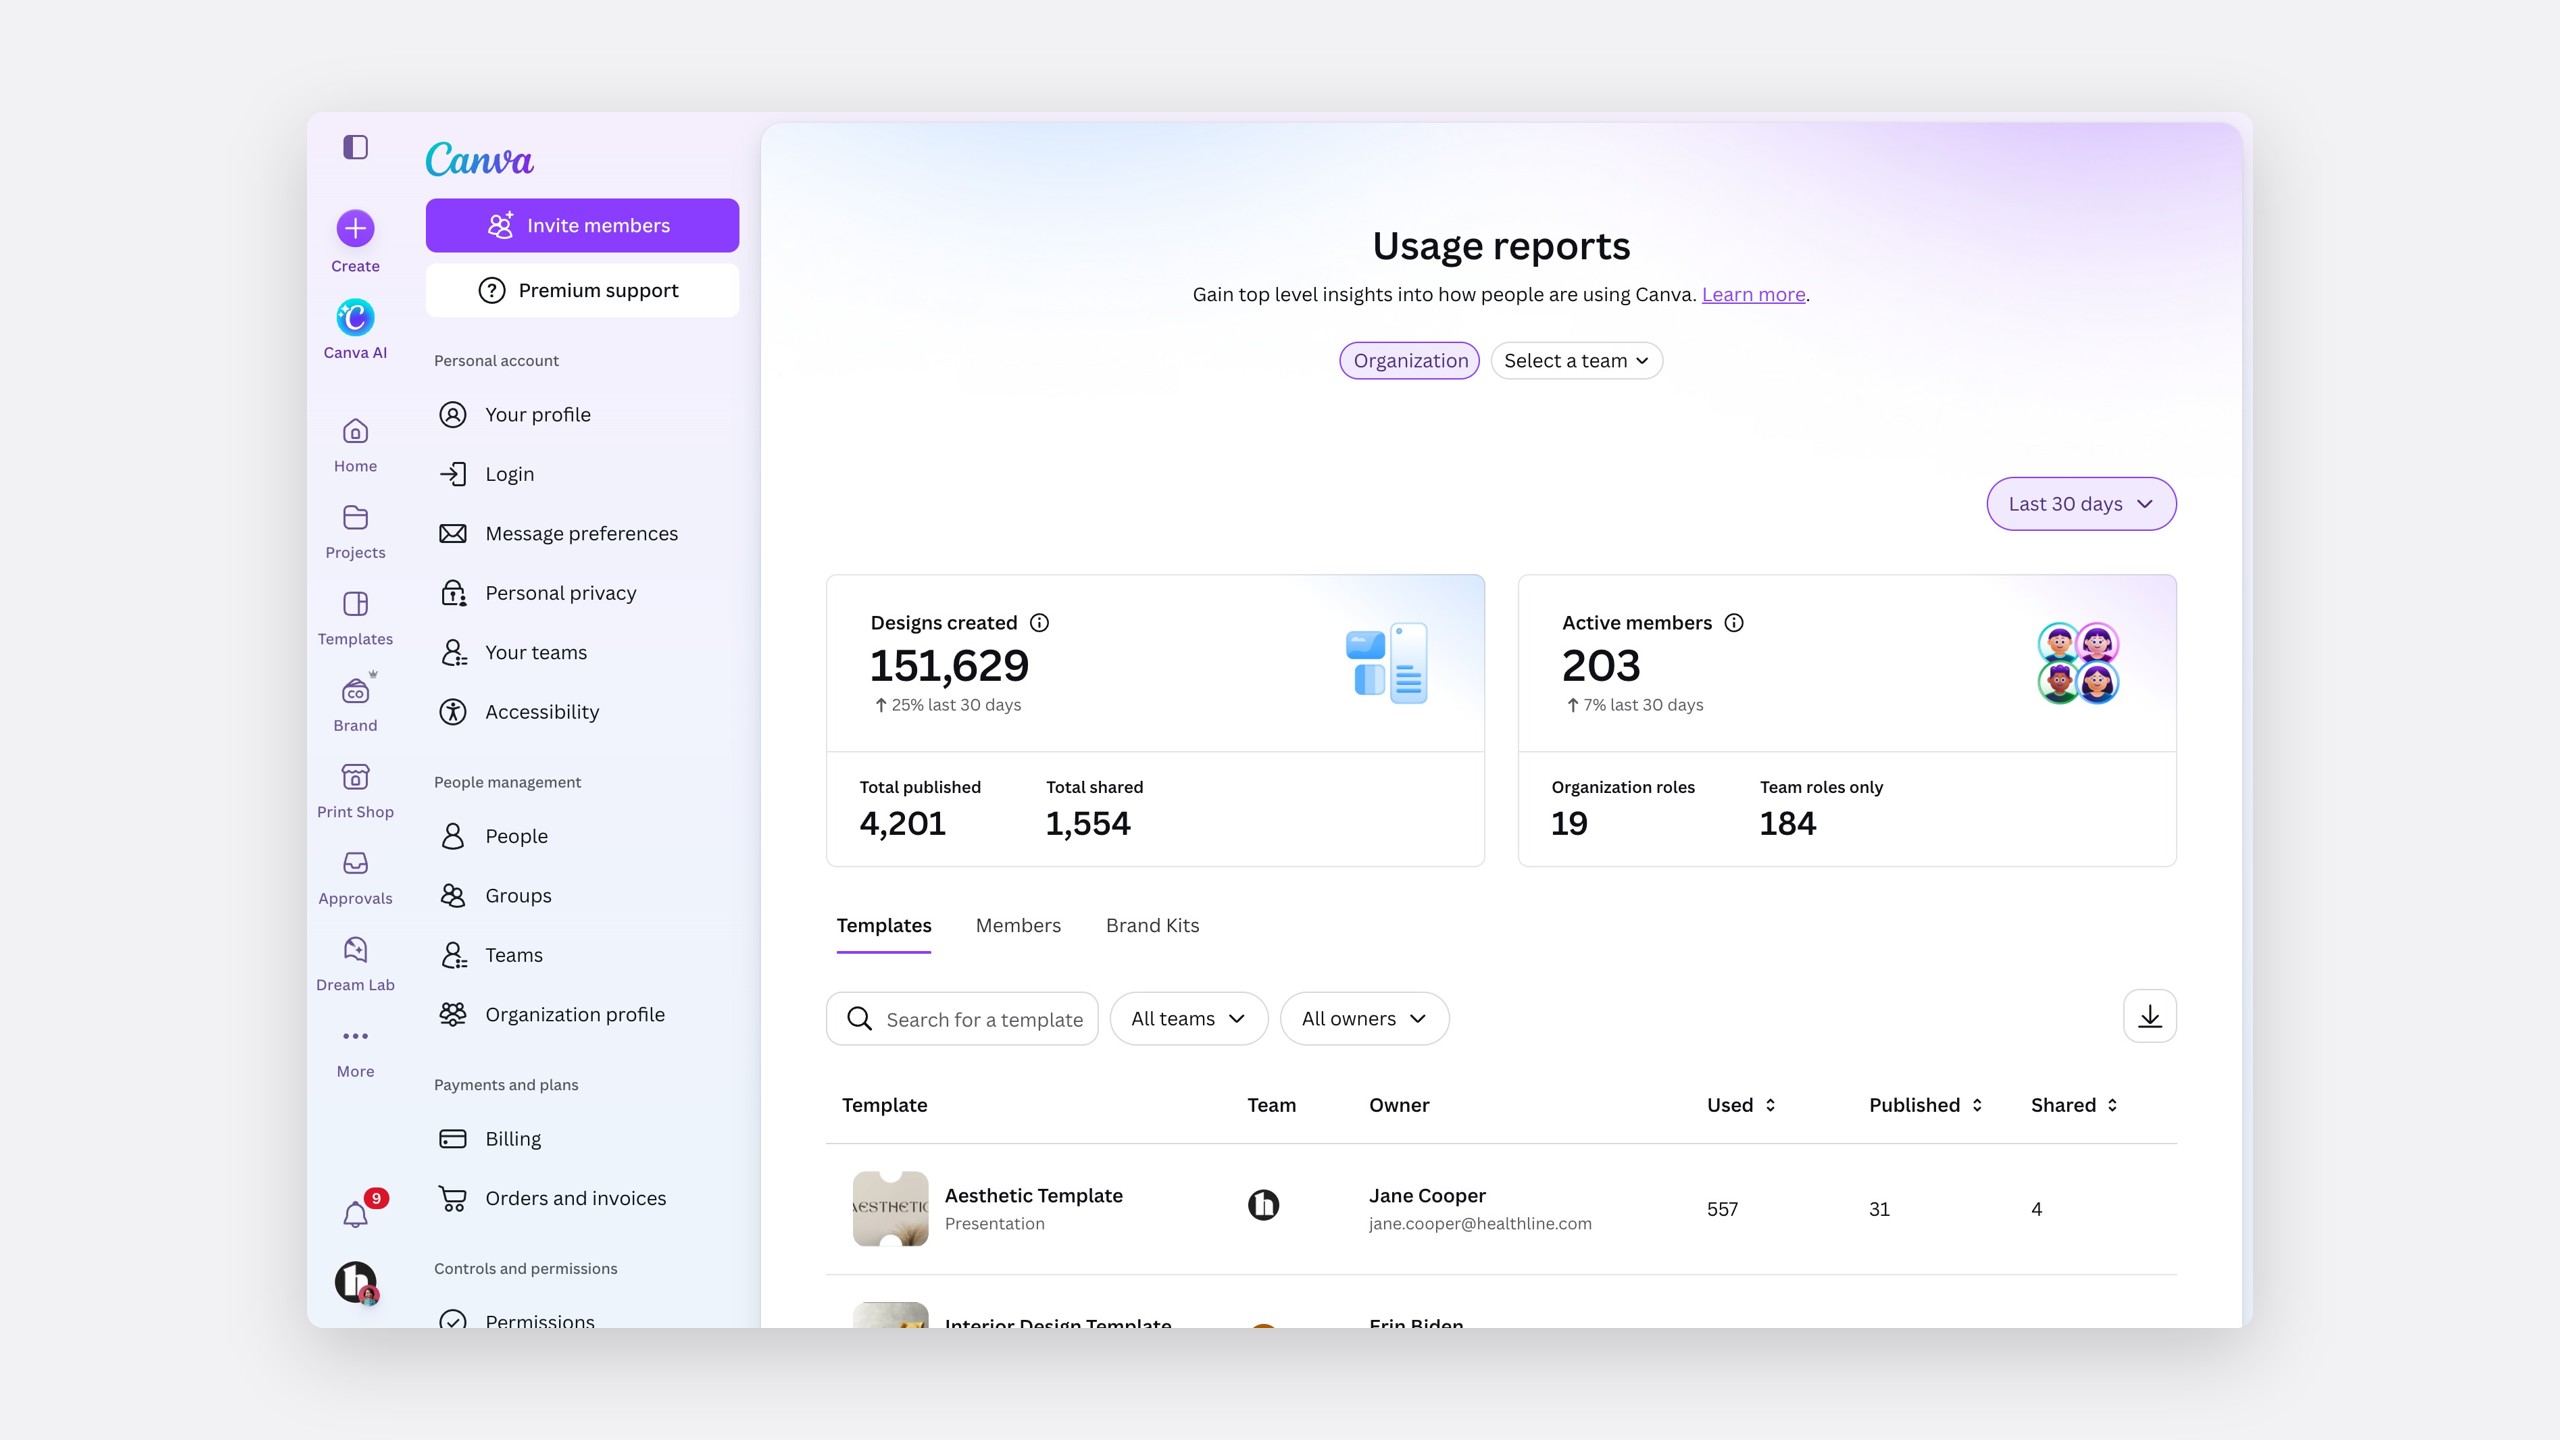
One frame
Every report shares one frame, filter row, date picker and empty state, the same move as the settings work.
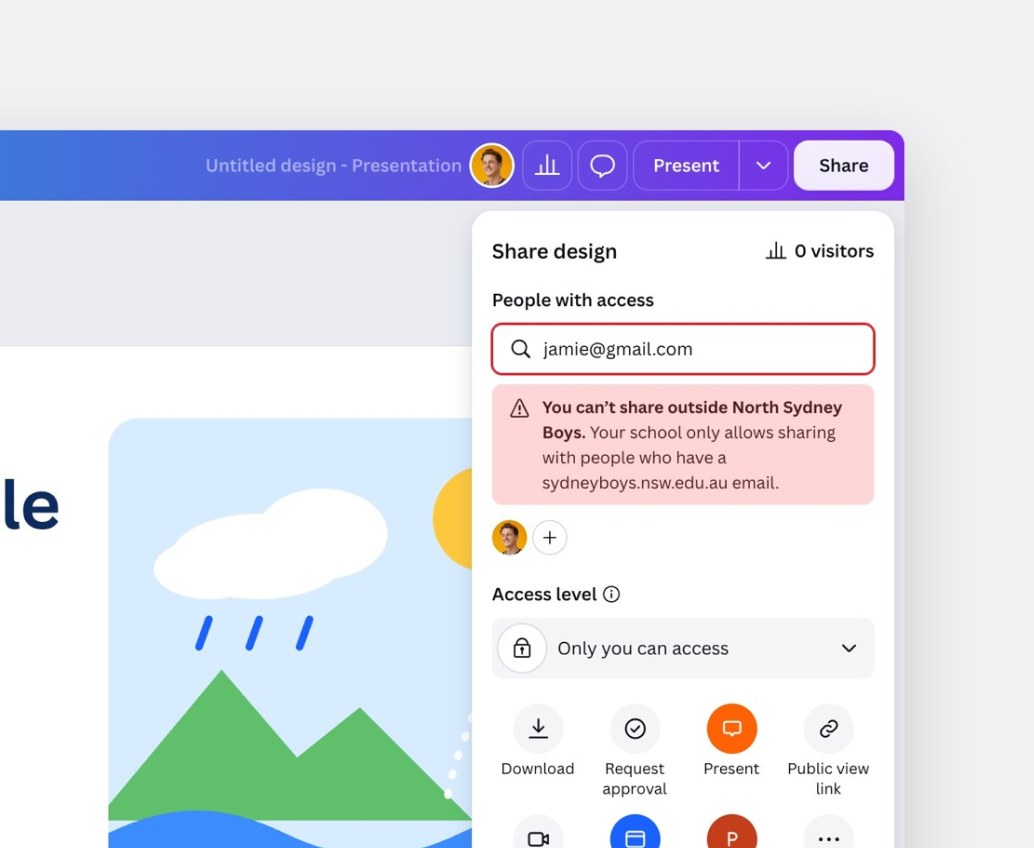
AI usage, plainly
AI Pass usage and credit-limit views flag users near their limit, in copy that says what is happening and who to talk to, without selling. An admin who feels tricked by a usage meter stops trusting every number beside it.
The impact
Heading into build
Reporting 2026 is in progress: parts are signed off for build, and a Magic reporting vision sets next year's direction.
Reflection